How to analyze TikTok statistics to know what your audience likes?
Views aren’t everything. Seriously. Even if your video hit 100 thousand views, it doesn’t mean it “worked” as it could have. If you want to grow on TikTok – as a creator, brand, freelancer, or someone just testing the formats – you need to look deeper than just the number of likes.
In this post, we’ll show you how to read TikTok statistics without feeling like you’re browsing an Excel report. We’ll help you understand which numbers really matter, what signals the algorithm to say: “hey, this is good, show it to more people” – and how to draw conclusions that will truly improve your reach.
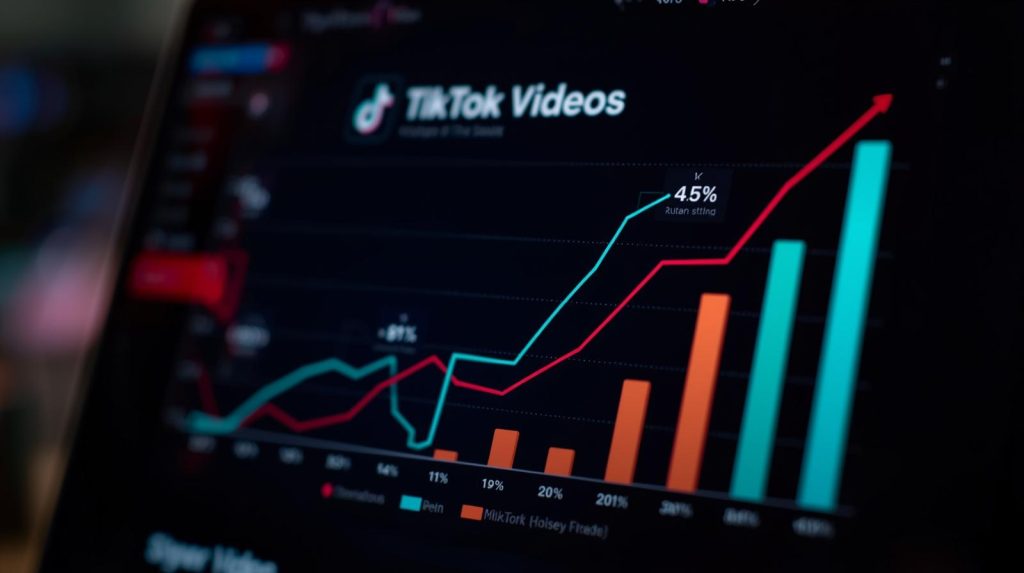
TikTok Analytics are not numbers to admire – but specific signals of what to improve
These are not trophies. Statistics are not a collection of accolades from the internet – they are tools that suggest what’s working and what should be discarded. If you take TikTok seriously (or even semi-seriously), you cannot afford to ignore the data.

Discover the potential of your personal brand!
Join a platform where creators can earn money online and build their personal brands by recommending products and services from brands and partners they truly respect.
Instead of focusing on the general number of views or likes, concentrate on questions like:
- did people watch until the end,
- did something capture their attention in the video or did they scroll past after 3 seconds,
- did someone find it through search, or only from your profile,
- did the video bring new followers, or just comments from regular viewers.
These are signals that speak to quality. And TikTok, like any platform, promotes not what is pretty – but what holds attention. That’s why it’s better to have 3,000 views and a 40% Completion Rate than 80k with a mass drop-off after the first sentence.
TikTok Analytics – where to even click and why you don’t see data from old videos?
Before we start analyzing anything, you need access to the tools. And here’s the first trap – TikTok statistics are only available for creator and business accounts. If you have a regular, personal account – you won’t see the “Analytics” tab or video details.
What to do immediately:
- switch your account to “Creator” or “Business” – you’ll find it under “Account Management”,
- go to Settings → Creator Tools → Analytics,
- if you want more data – log in to TikTok Creator Studio on desktop (studio.tiktok.com).
Note: data starts gathering from the moment statistics are activated. So if you have a viral hit from last week and you enabled the creator account yesterday – you won’t be able to retrieve anything from it. That’s why it’s better to get this sorted out before a video unexpectedly “takes off”.
Switching to a creator account costs nothing, doesn’t affect reach, and you don’t need to have a business. It gives insight into who watches you, when, and why – and that’s already something.
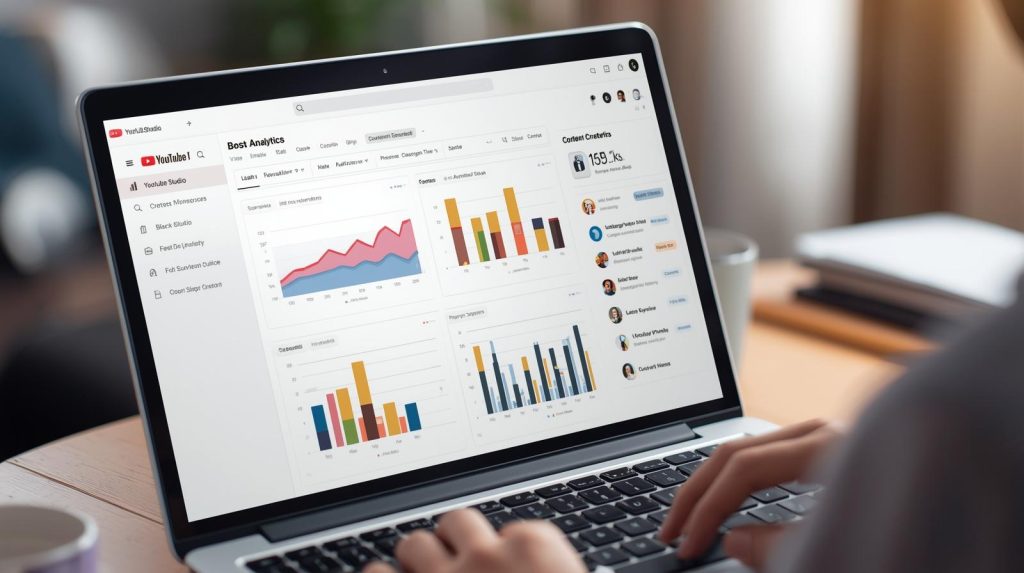
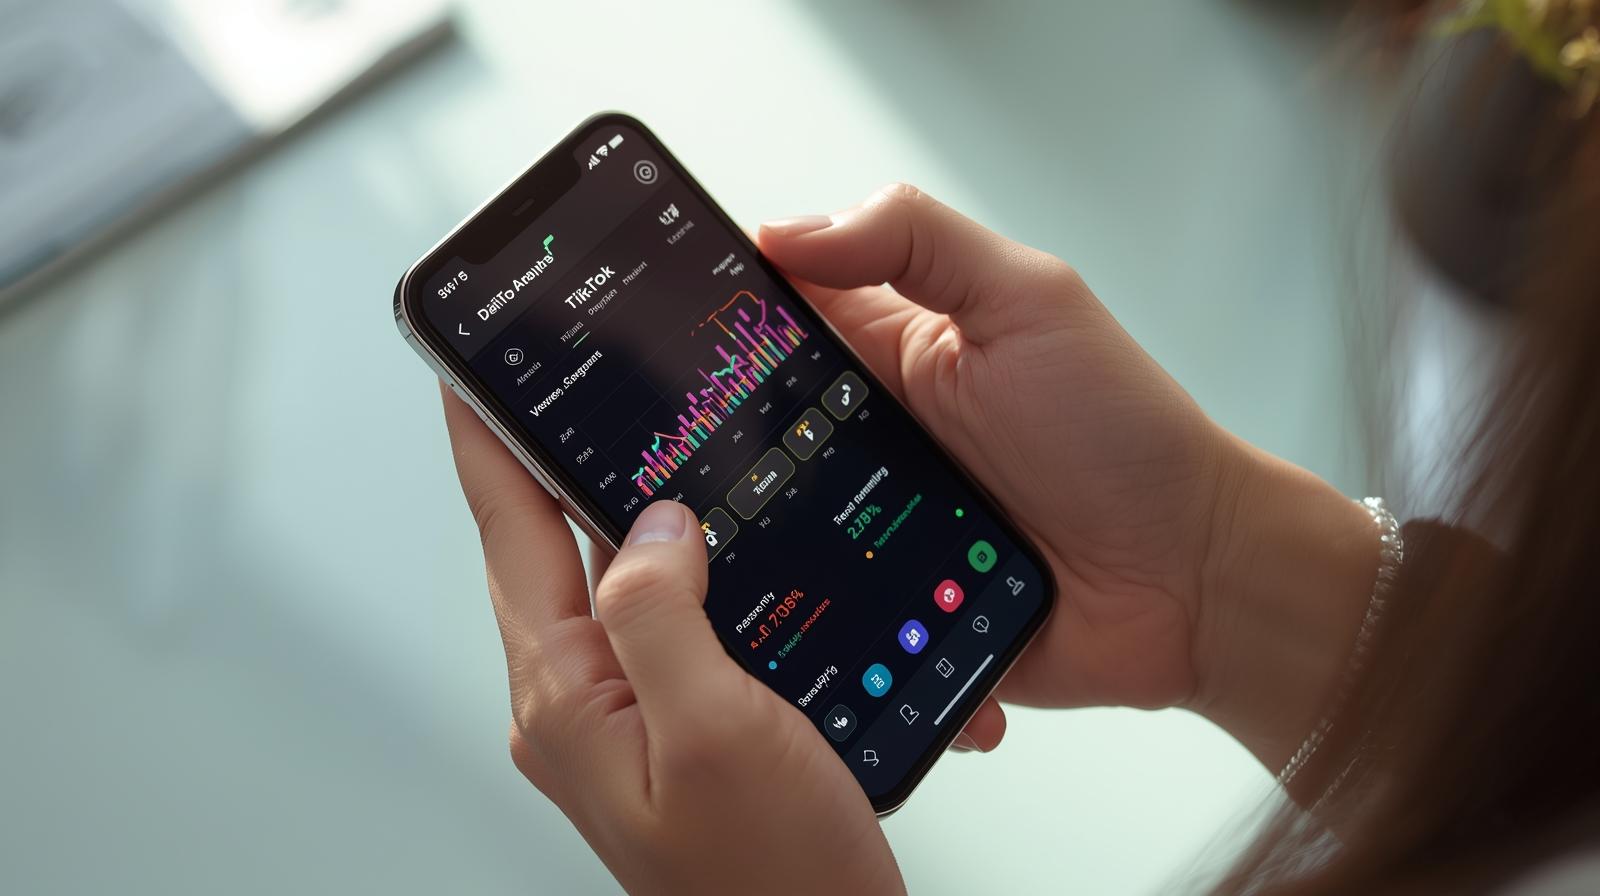
What do TikTok statistics really say? We break down the entire analytics panel into its components
The analytics panel on TikTok may seem modest, but it hides four key tabs, each telling something different. If we learn to read data like a map, each of them is a different part of the road – you need to know where to look.
A short guide.
- Overview – shows the number of views, likes, comments, shares, new followers, and reach. Here you see, what happened globally over the last 7–28 days.
- Content – the most important tab. Here you have each video individually, its Completion Rate, watch time, traffic sources, viewer location, CTR.
- Followers – shows gender, activity hours, countries, number of new follows. Ideal for testing the best publishing times.
- LIVE – if you do lives, here you’ll find data on the number of viewers, gifts, duration, etc.
It’s not just “for the curious.” If, for example, you see that 70% of viewers cut off your video at the 5-second mark – it means the hook isn’t working. If you have a lot of visits from the “Profile” tab – maybe it’s worth pinning videos and updating the bio? The data doesn’t make sense until you ask the right questions.
Completion rate and average watch time – two indicators that decide if your video gets a second chance
Not every video stands a chance for a second life – but TikTok’s algorithm can bring back what has good viewership statistics. And this is where two key data points come into play: Completion Rate and Average Watch Time. Without them, it’s really hard to draw sensible conclusions from the content.
Completion Rate is simply the percentage of people who watched your video to the end. Example? If you have a video 15 seconds long and the average watch length is 13 seconds, the CR is about 86%. The closer to 100%, the better – but already anything above 70% is a very good result.
Average Watch Time (i.e., the average viewing time) tells how long you truly hold attention. And here’s the kicker: if a video is 12 seconds long and the average watch time is 5 – it means most people drop off before you develop the topic. That’s a red flag, especially if you’re complaining that “TikTok cuts reach.”
If we have a problem with this, the most common culprit is:
- weak hook in the first 2-3 seconds
- a long introduction with no specifics
- slow pace or chaos in the narrative
- visually unintelligible opening scene
We begin to look at films as micro-experiments: “did it catch the viewer’s attention? Is it worth testing a similar style again?” Data has no favorites – it only shows what works.
TikTok Stats Without the Hype – How to Read Traffic Sources to Know if You’re Going Beyond the Bubble?
Some videos have tens of thousands of views… and zero effects. Others have only 1,500 but bring in 20 new followers. Why? Because it’s not just about the quantity, but aboutwherethe people came from. Traffic source tells a lot about whetheryou’re actually reaching new people or just warming up your fanbase.
Main sources in statistics are:
- For You – the most valuable traffic. If there are many entries here, it means that the algorithm is recommending you to strangers,
- Followers – warm traffic. These are your people – it’s nice they are there, but this doesn’t expand your reach,
- Profile – someone visited your profile and started the video. A good sign that something piqued their interest,
- Search – a gem. It means your content was specific and people were looking for it.
Ideally, when we see the “For You” tab dominating the statistics of a new video. This means TikTok is testing it on new users – and if the reactions are good (watch time, engagement), the video gets a second and third life.
If everything comes from “Followers” – it means it’s time to change the hook, thumbnail, topic, or pace. Or everything at once.
What to Analyze Weekly to Avoid Meaningless Numbers?
Checking statistics once a month is a bit like checking your account balance once every six months – you kind of see something, but you don’t know where the money went. That’s why it’s worth having a short weekly checklist that allows for drawing specific conclusions – and without an Excel table.
Below is a sample set.
- Check the top 3 videos from the last week – what do they have in common? topic? hook? length?
- See which videos had >70% Completion Rate – these are formats worth repeating.
- Did any video break into the “For You” tab? – note what exactly changed in it.
- Check publication days and times – when are your audience most active?
- Extract 1-2 micro-lessons – e.g., “a video with text on the screen works better than with narration.”
- Don’t analyze likes without context – a like is nice, but it’s not a metric of effectiveness.
It’s only 10-15 minutes a week, but that way you know which direction to go. And you don’t need any agency to optimize content.
FAQ
I don’t see any statistics – why?
You probably have a personal account. TikTok statistics are only available for Creator or Business accounts. Change it in account settings → Account Management → Switch to Business/Creator account. After the change, data will start collecting from the activation moment – you will not see statistics for previously published videos.
What is Completion Rate and what result is “good”?
Completion Rate is the percentage of people who watched your video from start to finish. The higher, the better – because TikTok loves content that “closes the loop.”
- >70% – very good,
- 50–70% – okay, worth working on the pace,
- <50% – probably too slow a start, long introduction, boring hook.
A high CR is often a signal for the algorithm: “it’s worth showing this video once more to someone new.”
What does Average Watch Time mean and how to interpret it?
It is the average number of seconds that viewers watched your video.
Example: you have a 20-second video, and the average watch time is 8 seconds – meaning most people drop off after the intro. A good video has an average watch time close to the length of the material. If you make short forms (up to 15s), an average >10s is a very good result.
Do the statistics show who watches my videos?
They do not show specific individuals. But in the “Followers” tab you have:
- countries from which viewers come,
- gender,
- hours of highest activity,
- growth of new followers.
It’s an ideal place to check when it’s best to publish and if you’re hitting your target group.
What are traffic sources and which ones are the best?
Traffic sources show from where viewers came to your video. The most important are:
- For You – the best! This means new viewers outside your bubble,
- Followers – your current community,
- Profile – someone was on your profile and clicked the video,
- Search – people were searching for a given topic.
If most of the traffic comes from “For You” or “Search” – it means the video has viral potential or SEO.
Do likes even matter?
Yes, but they are not the most important. TikTok analyzes the entirety: watch time, comments, shares, and only then decides about further distribution. Likes are a “soft” signal – it’s nice to have them, but retention and reactions matter more.
Is it possible to handle statistics without Creator Studio?
Yes – all the essentials can be found in the app in the Statistics tab. But TikTok Studio on desktop offers greater comfort and transparency, especially if you do regular analyses. You can also download data, take screenshots, and compare periods.
I check the statistics every week, but I don’t know what to change. How to manage it?
Apply a simple rule: seek repeatability. If three videos with >70% Completion Rate had a similar length or style – that is your style.
Create a checklist:
- which hook worked best,
- what was the length of the video,
- what happened at the beginning – text? question? gesture?
The data is only a guideline – the rest is your interpretation and experiments.

Sandra Siadlak is a Project Manager at RefSpace, where she ensures that people and algorithms understand each other. Before entering IT, she worked in the education industry. Today, she combines her passion for technology with psychology and dietetics, writing about AI, automation, and broadly defined health in everyday digital life.